

Your leadership team asks about the Q1 webinar: "120 of 300 registrants showed up. Is that good?" Your first search says 40%, the second says 58%, the third says 61%. All three numbers are correct, because the 2026 webinar benchmarks measure different things.
The 2026 webinar benchmarks at a glance
All figures come from platform data of the respective vendor and describe that vendor's customer base. Goldcast and BigMarker explicitly analyze B2B webinars. Use the values as a frame of reference for your planning.
| Source | Data basis | Attendance rate | Avg. registrants / attendees |
|---|---|---|---|
| Goldcast, 2026 B2B Webinar Benchmark Report | 26,190 webinars, 522 B2B organizations, platform data Jan 1 to Dec 31, 2025 | 40% "attendance rate" (2024: 33%) | 251 / 102 |
| ON24, Digital Engagement Benchmarks 2026 | Platform data 2025 (scope not stated) | 60% "conversion rate of registrations to attendees" | n/a / 239 |
| BigMarker, 2025-2026 B2B Webinar Benchmark Report | Platform data, over 2 million events in the reporting year according to the vendor | 49% "show-up rate" (live only; high performers 58%) | 322 / 171 |
| Contrast, 2026 Webinar Benchmarks | "1M+ registrants", platform data, period not stated | 61% watch live or on demand; live approx. 44-50% | n/a |
| TwentyThree, State of Webinars 2026 | Survey of 133 webinar owners plus anonymized platform data ("1000s of webinars") | 58% "avg. attendance rate" (platform data) | 308 / 154 |
On-demand shares and further figures:
| Source | On demand | Other values |
|---|---|---|
| Goldcast | 89.1% of webinars available on demand; on-demand viewers = 15.9% of all viewers | Avg. 56.8 min, median 60 min; Q&A in 56.1%, polls in 19% of webinars; completion rate on demand 91%, live 74% |
| ON24 | Figures inconsistent (50% vs. 43% on-demand share), therefore not used | Avg. 49 min engagement time; avg. 150 poll responses per webinar |
| BigMarker | 83% published on demand; replays drive on average 1.8x more registrations | Avg. 13 Q&A questions and 87 poll responses per webinar; Tue/Wed/Thu together = 80% of webinars |
| Contrast | 42% of views on demand | Tuesday: 50% live attendance |
| TwentyThree | 19% "on-demand conversion rate" (definition not stated) | Thursday: 64%; mornings (7-10 am, time zone not stated): 62%; avg. viewing time approx. 40 min |
Short answer: Across these studies, 40 to 61% of registrants attend, depending on definition and vendor. Plan with a range and compare yourself mainly with your own past results.
Why webinar attendance rates differ so much
Different definitions. BigMarker counts only live attendance: people who attend the live webinar divided by everyone who registered. Contrast counts live and on-demand viewers together and arrives at 61%. In the Goldcast and ON24 reports, it is not clear whether on-demand viewers are part of the rate. Read their numbers as a general "attendance rate".
Different customer bases. Every number mirrors the vendor's customers: company size, industry, region and brand strength. BigMarker itself reports that show-up rates drop with larger lists, and that customer education events reach higher rates than top-of-funnel webinars. Contrast reports 6% higher live attendance for webinars with fewer than 100 registrations.
Averages and outliers. Goldcast reports an average of 486 registrations for Thursday webinars, but a median of only 80. A few very large, recurring events pull the average up. Goldcast itself considers the median the more typical benchmark.
Calculation method. TwentyThree reports 58%, but an average of 308 registrations and 154 attendees works out to 50%. One possible explanation: the rate averages individual webinars, and small webinars often reach higher rates. When in doubt, plan with the lower value.
Compare yourself with the study whose definition matches how you measure.
Working backwards: How many webinar registrations do you need?
Use this formula: Required registrations = target attendees ÷ attendance rate.
Example for 100 live attendees:
| Assumption | Source | Required registrations |
|---|---|---|
| 40% | Goldcast | 250 |
| 49% (live) | BigMarker | 205 |
| 58% | TwentyThree | 173 |
| 60% | ON24 | 167 |
For total reach across live and on demand, Contrast's 61% means 164 registrations for 100 viewers. Contrast's own rule of thumb: about 160 registrations for 100 viewers. You can raise registrations with an optimized registration page, and well-timed reminder emails raise your show-up rate.
Planning tip: Start with the conservative 40% and adjust once you have your own history. A target of 100 live attendees then means 250 registrations.
Day, time and length: What the studies say
The studies name different best slots:
| Source | Recommended day | Rate | Further notes |
|---|---|---|---|
| Goldcast | Tuesday | 41.2% at avg. 294 registrations | Monday (47.2%) and Friday (46.9%) show the highest rates but attract the fewest registrations |
| Contrast | Tuesday | 50% live attendance | Wednesday and Thursday: 47% each |
| TwentyThree | Thursday | 64% | Friday: 63%; mornings between 7 and 10 am (time zone not stated): 62% |
| BigMarker | none stated | n/a | Tuesday to Thursday together account for 80% of webinars |
Goldcast states times in US Eastern Time and names 12 pm ET as the most common start (16% of webinars). That is usually 6 pm in Germany. Test such slots with your own European audience.
On length, Goldcast reports a median of 60 minutes, while 30-minute webinars are growing (15.5%, up from 13.2% in 2024). TwentyThree reports that 69% of webinars last about an hour.
Interaction and on demand
Chat and Q&A are the most-used interaction features: Goldcast finds chat in 62.3% of webinars, Q&A in 56.1% and polls in 19%. On demand is standard. At Goldcast, 89.1% of webinars offer a recording, and BigMarker finds that replays bring 1.8x more registrations on average.
The on-demand share is 15.9% of viewers at Goldcast and 42% of views at Contrast. A pure live rate leaves this part of the audience out.
Measure your own benchmarks with MEETYOO Show
Your reference value comes from your own webinars. MEETYOO Show delivers the data per person and stores it in EU data centers.
| Finding from the studies | What you do in MEETYOO Show |
|---|---|
| Vendors count differently: live only or including on demand | Webcast analytics shows registered viewers, live attendees and the no-show rate. Per person, you see whether someone watched live only, on demand only, both or not at all. |
| 15.9 to 42% of viewers watch on demand, replays bring 1.8x more registrations | Pseudo-Live plays the recording as a premiere, without live production and without a moderation team in the studio. You decide when it becomes available on demand. AI chapters and key moments make the recording easier to navigate. |
| Q&A runs in 56.1% and polls in only 19% of webinars | Q&A, polls and moderated chat are part of the engagement toolkit and included in every plan, including the Forever Free Plan. |
| Audience and source influence the rate | UTM parameters from your campaign link land in the attendee profile. You export attendance data as CSV for your CRM and lead scoring. More on the Marketing & ROI page. |
| Attendance and engagement data exist per person | MEETYOO Show is ISO 27001 certified and GDPR compliant, and all event data is stored on EU servers. That matters once you evaluate attendance and engagement by name. |
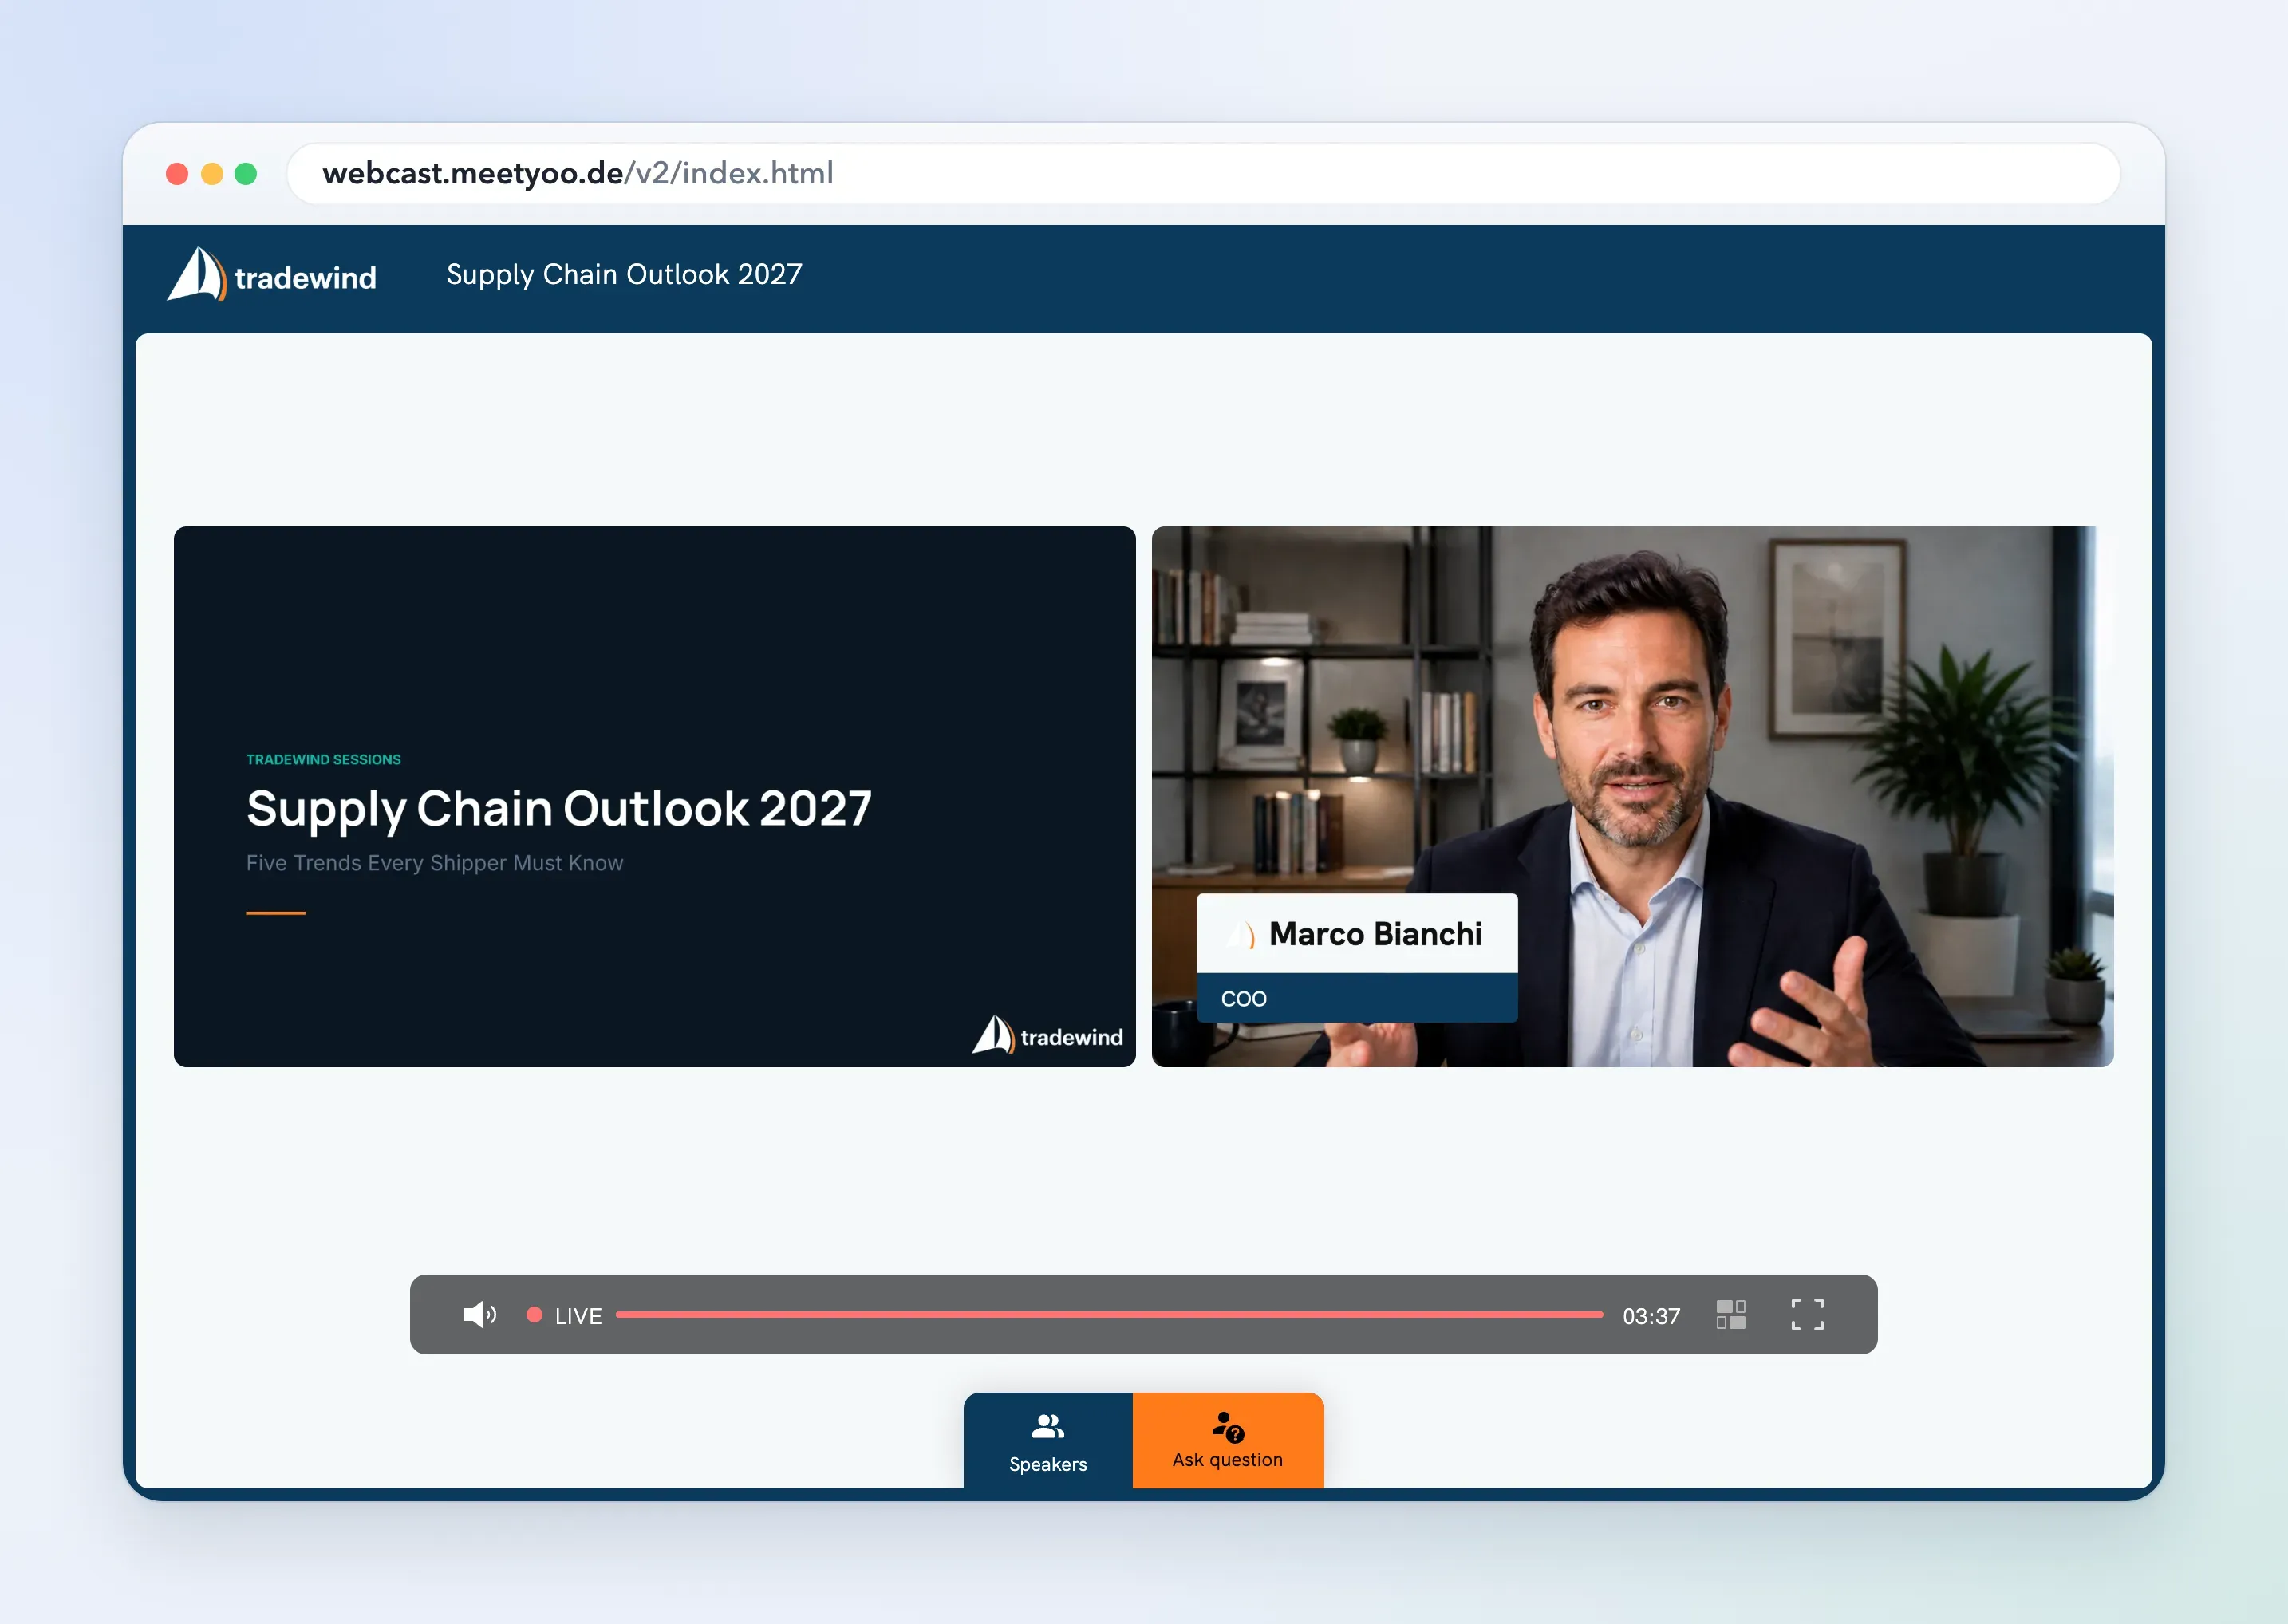
Your own benchmarks without a budget: The Forever Free Plan is permanently free, has no expiry date and needs no credit card. It includes up to 500 registrations per event, 2 hours of live streaming per month and 10 hours of on-demand content, plus all engagement tools. Goldcast, TwentyThree and BigMarker report an average of 251 to 322 registrations per webinar. That fits within 500 registrations.
Conclusion
The 120 of 300 from the example equal 40%, the Goldcast value. BigMarker reports 49% for live attendance only. Whether 40% is good depends on whether the recording was counted. Take the value as a starting point and measure it at your next webinar with the same definition.
To turn attendance into KPIs and ROI, read our guide to webinar ROI.
FAQ
What is a good webinar attendance rate?
Depending on study and definition, 2026 averages range from 40% (Goldcast) to 61% (Contrast, live and on demand combined). For live attendance only, BigMarker reports 49% and Contrast 44 to 50%.
How many registrations do I need for 100 attendees?
Divide your target number of attendees by the expected attendance rate. At 40% you need 250 registrations, at 60% about 167.
Which day is best for webinars?
The studies disagree. Goldcast recommends Tuesday, TwentyThree measures the highest rate on Thursday, Contrast on Tuesday. Test two slots with your audience.
How important is an on-demand recording?
The on-demand share ranges from 15.9% of viewers (Goldcast) to 42% of views (Contrast). Goldcast reports that 89.1% of webinars offer a recording, and BigMarker finds that a replay brings 1.8x more registrations on average.
Why do webinar benchmarks differ so much?
Vendors measure differently (live only or including on demand), and their numbers come from their own customer base. The calculation method matters too: the average of individual rates differs from the ratio of averages.
How do I measure the attendance rate of my webinars?
Divide the number of attendees by the number of registrants and decide in advance whether on-demand viewers count. MEETYOO Show reports registered viewers, live attendees and the no-show rate, and separates live, on-demand, both and no view. You can also explore analytics in the permanently free Forever Free Plan.


