
Qualify Leads After the Event
Export participants with 30-plus minutes of viewing time and pollparticipation. Give sales a prioritized list with context: what they asked and howactively they engaged.
Your leadership wants to know who actually watched and what the eventdelivered. MEETYOO Show gives you one complete analytics report: attendance,engagement, and exportable audience data, all in one dashboard.
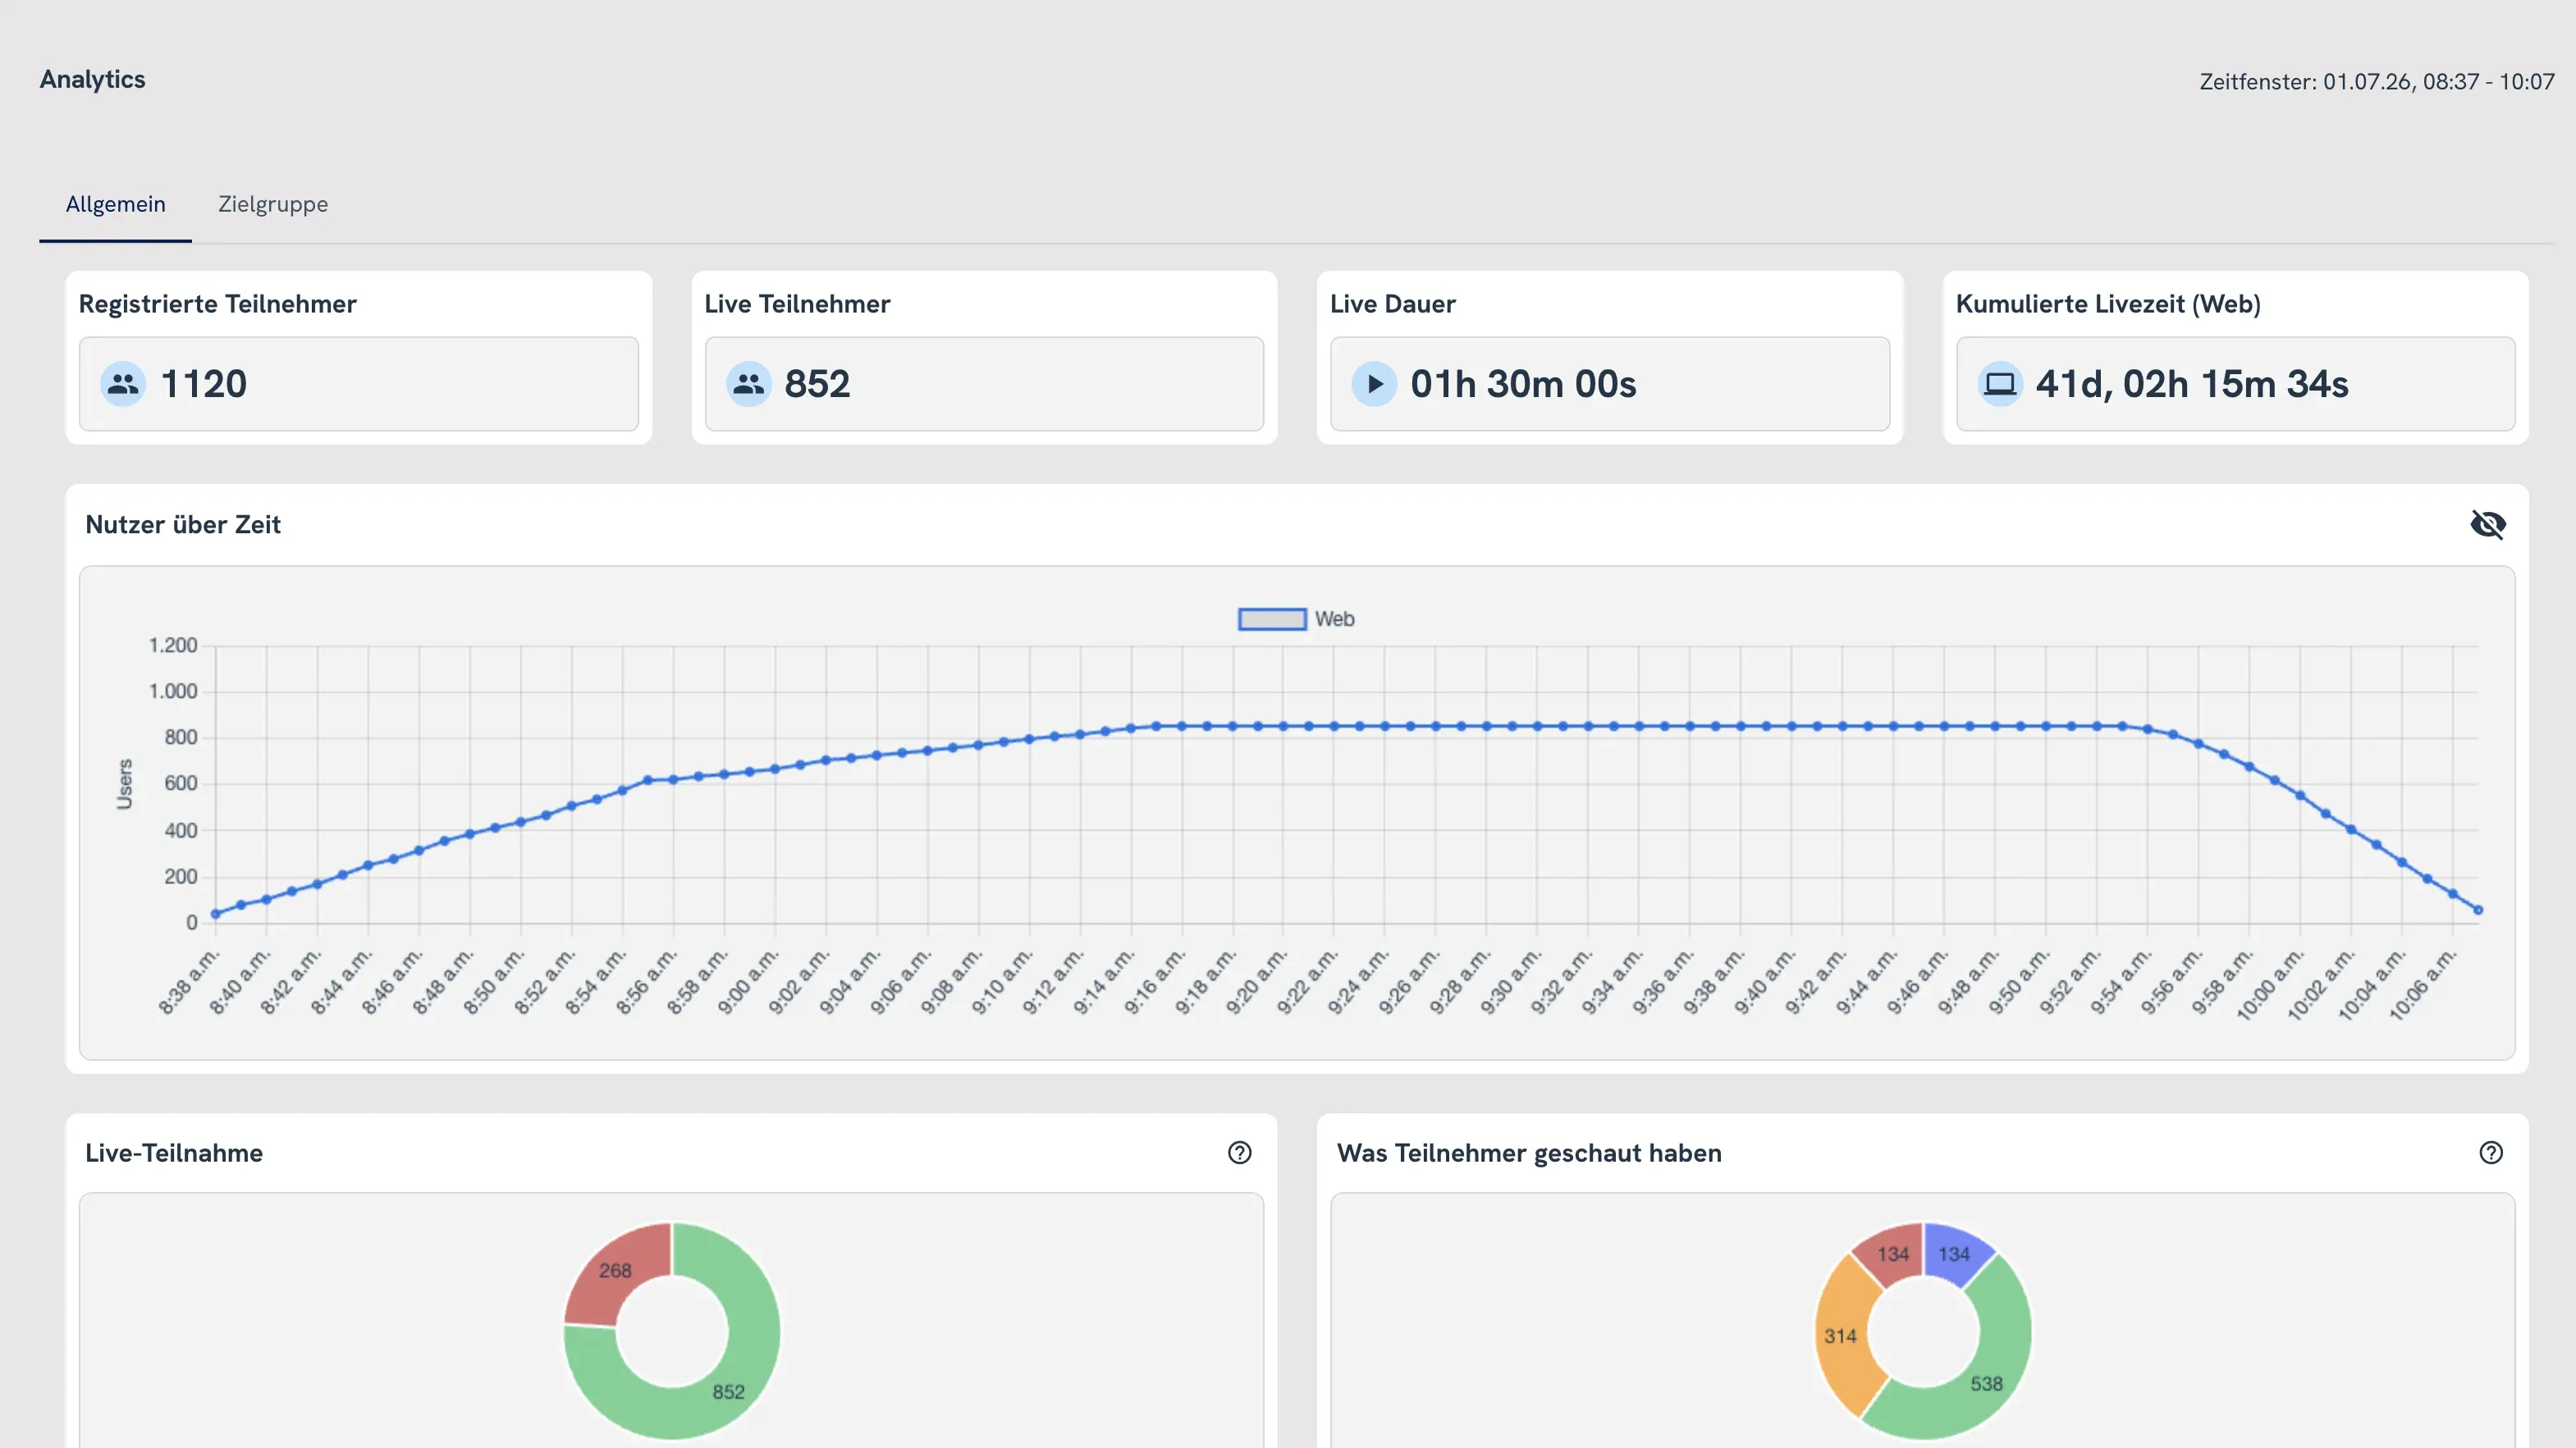
Generic webinar tools stop at a headcount. That tells you neither thevalue of your event nor how to make the next one better.
The General tab shows you KPIs and charts in real time as soon as yourwebcast starts, and keeps updating long after.
Accumulated live duration adds up every viewer minute: 1,000 peoplewatching 90 minutes equals 1,500 hours of attention. That is the true reach value ofyour event.
The Audience tab turns aggregate metrics into searchable, sortable, andexportable lists.
Live viewing time, on-demand time, total connection time, andattendance status per person. Search, sort, and export the full list with emailaddresses for your follow-up.
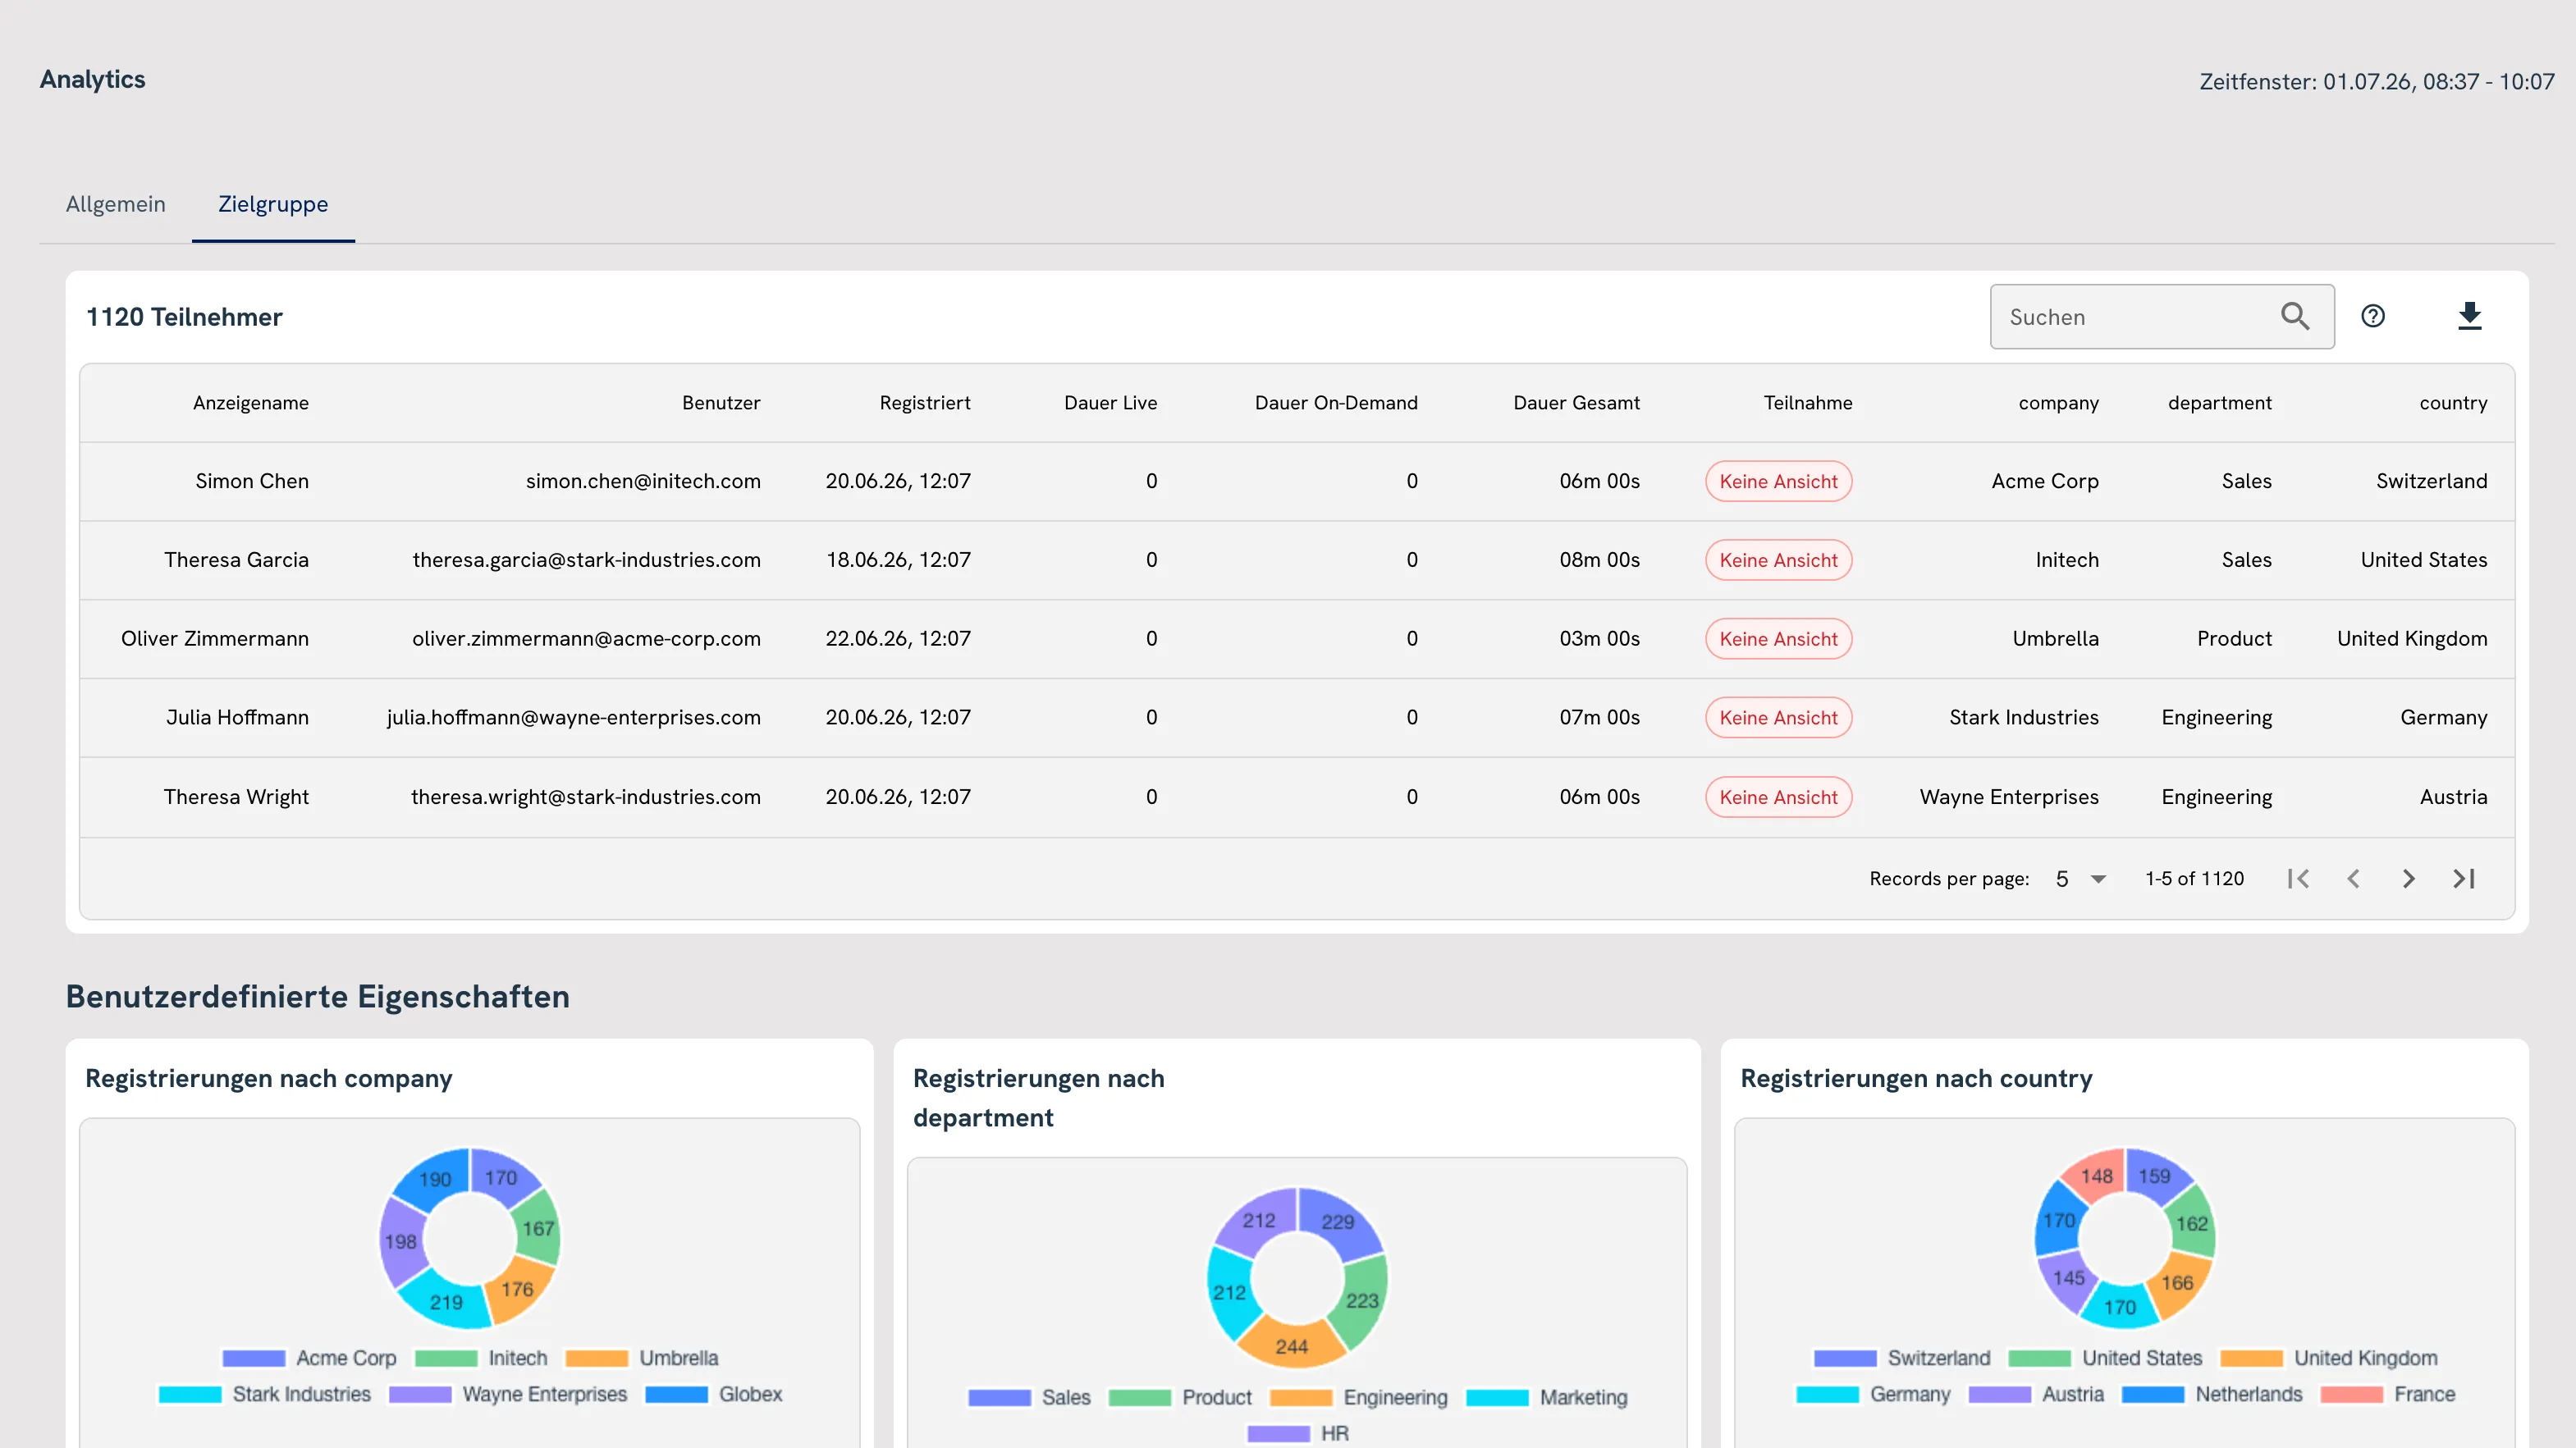
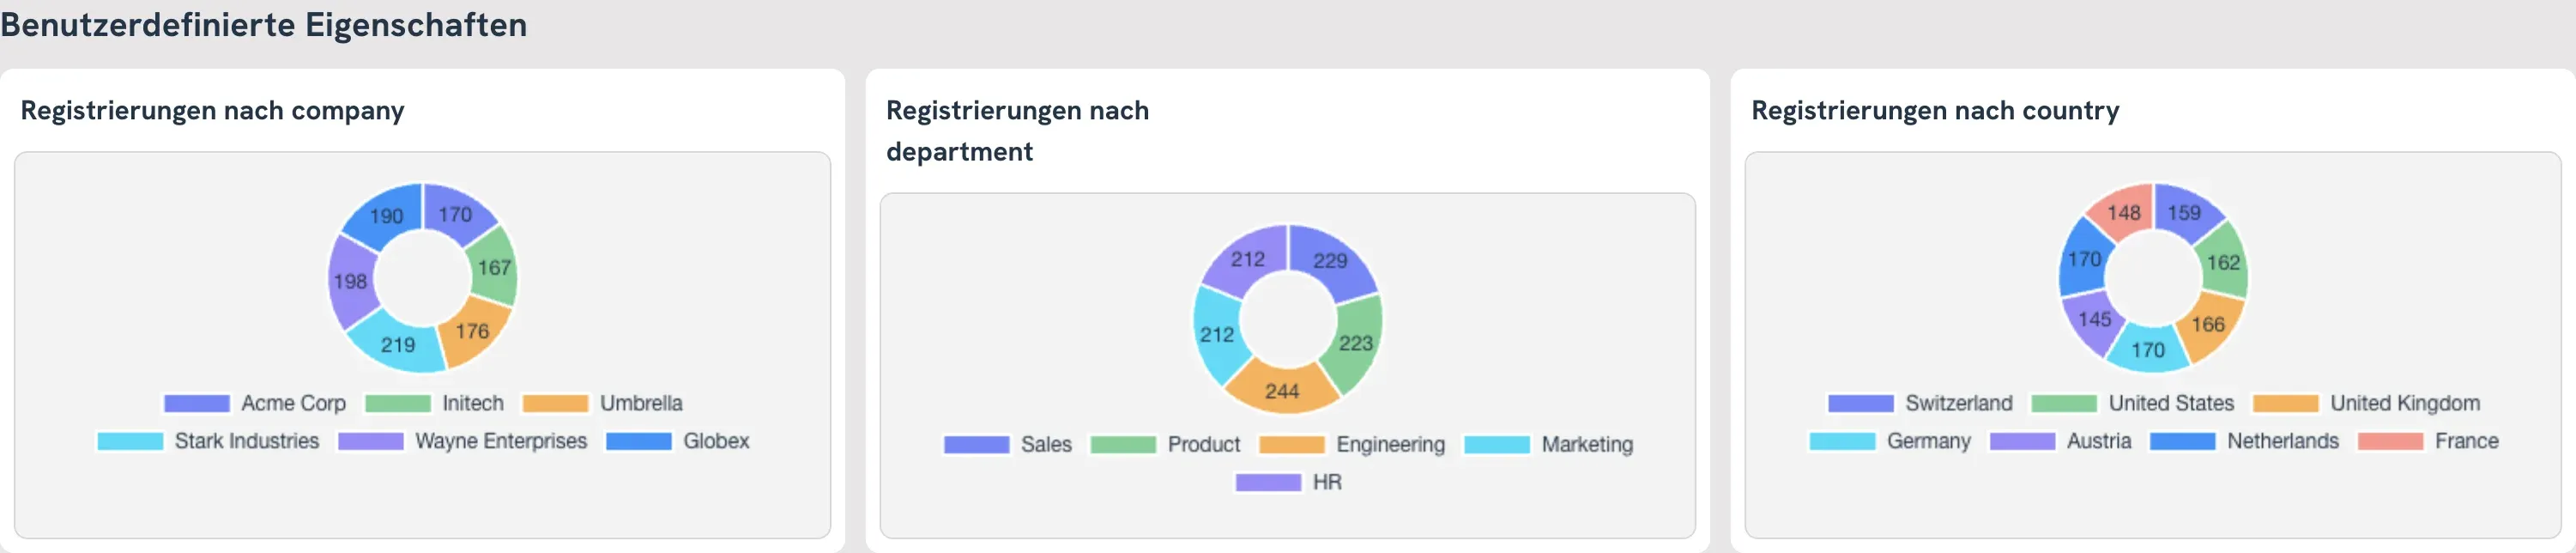
Registration fields like company, department, and countryautomatically become segment charts, connecting your sign-up strategy directly topost-event reporting.
Q&A with upvotes, poll results, survey responses, chat messages, andresource downloads, with charts for closed questions and CSV export for everything.
Turn reporting into decisions, for marketing, sales, and your next eventformat.
Export participants with 30-plus minutes of viewing time and pollparticipation. Give sales a prioritized list with context: what they asked and howactively they engaged.
Spot drop-offs in the viewer curve. If you lose attention aroundminute 40, it is worth shortening that block or adding an interactive poll to keep theaudience engaged.
Custom property charts reveal which companies, departments, andregions you actually reached, not just the ones you intended to invite.
When on-demand views exceed live attendance, your recording becomes along-term asset. Pair analytics with AI chapters and search to keep building valueafter the event.
Audience, chat, Q&A, polls, and surveys, all in one MEETYOO analyticsdashboard. Every table exportable as CSV.
Get answers to common questions about MEETYOO Show
The dashboard updates in real time. During the live webcast you already seethe viewer curve. Full engagement data, including polls, surveys, and Q&A, isavailable immediately after the event ends.
You can invite team members as event admins so they can access thedashboard directly. Every data table can also be exported as CSV and shared withstakeholders.
We store all event data in compliance with GDPR on EU servers. How longyour data is retained depends on your plan. Enterprise customers can arrange customarchiving periods with us.
Custom properties are additional registration fields such as company,department, or country. Once enough data is available, they appear automatically assegment charts in the Audience tab.
Yes. The Q&A table shows the upvote count for each question. Sort byupvotes to find the topics your audience cared about most.
Polls are live single-choice votes during the event with instant results.Surveys are multi-question feedback forms, often at the end of an event, with chartsfor closed questions and CSV export for open text responses.
Live means the viewer joined during the live stream. On-demand means theywatched the recording only. Both means they watched live and returned to the recordingafterwards. No View means someone registered but never logged in.
Yes. Export any table as CSV and import it into your CRM, marketingautomation platform, or other tools for segmentation, lead scoring, and follow-upcampaigns.
Yes. For event series, attendance and audience data are available acrossall events. The detailed engagement summary is accessible for each individual event.
Yes. When participants join by telephone, their metrics and accumulatedtelephone live time appear in the General tab alongside the web analytics.
Can't find the answer you're looking for?
Contact Our TeamSee how MEETYOO analytics turns every event into concrete insights andbuilds your next decision on real data.
Speak with our team and walk through a live analytics report in action.
We usually reply within 1 business day. No commitment.
Run your next webcast on MEETYOO Show and explore analytics on the freetier.
Start for FreeGDPR compliant · ISO certified · Made in Germany


